

Start with what the national figure means
The U.S. Bureau of Labor Statistics reports that the median annual wage for electricians was $63,190 in May 2025, or $30.38 per hour. The median is the midpoint: half of workers in the occupation earned more and half earned less. It is not a guaranteed starting wage or the salary of a worker at a particular license level.
BLS also reports that the lowest 10 percent earned less than $42,640 and the highest 10 percent earned more than $108,510. Those percentiles describe the wage distribution. Do not relabel them as apprentice, journey-level, or master-electrician pay bands.
Why one number cannot predict your offer
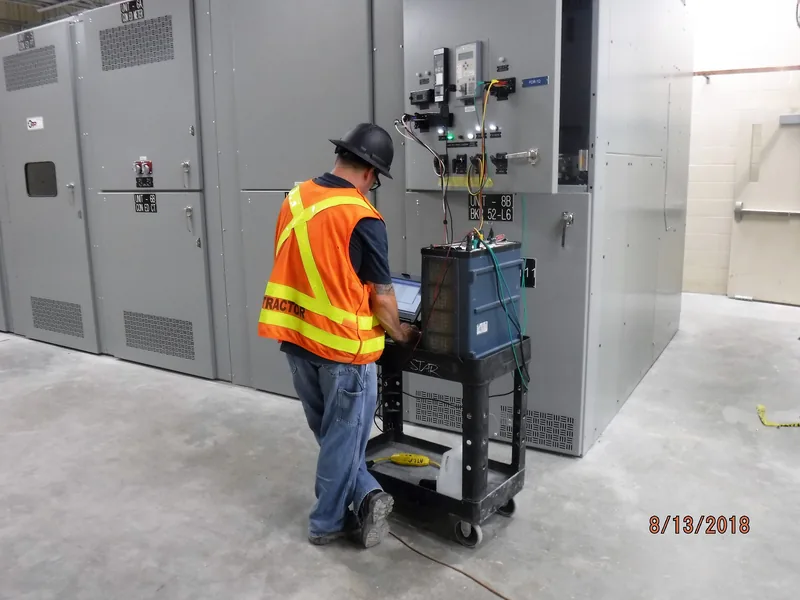
BLS explains that earnings within an occupation vary by experience, responsibility, performance, tenure, and geographic area. Its electrician profile also reports different medians for major employing industries and notes that schedules may include overtime. Use a current job posting or apprenticeship wage schedule when evaluating one opportunity rather than treating the national median as an offer.
The BLS Occupational Outlook Handbook notes that its wage data do not include self-employed workers. Keep employee wage statistics and self-employment research separate.
Apprenticeship pay follows a different structure
Registered Apprenticeship is paid employment with progressive wage increases. BLS likewise notes that apprentices earn less than fully trained electricians and that pay increases as they learn to do more. The actual starting rate and progression belong to the employer or program sponsor, so request the current written wage schedule for the specific program.
When comparing apprenticeships, include scheduled raises, work availability, classroom time, dues or fees, benefits, travel, tool costs, and the completion credential. A higher hourly rate may not produce higher annual earnings if hours are irregular or required travel is expensive.
Compare place and industry with matching data

BLS’s Occupational Employment and Wage Statistics program publishes electrician estimates for the nation, states, metropolitan areas, and nonmetropolitan areas. Use the same occupation and data year when comparing locations. A statewide estimate and a city job offer answer different questions.
The May 2025 national profile also shows different medians among major employing industries. That does not prove that changing industries alone causes a pay increase; job duties, experience, location, bargaining arrangements, and employer requirements may differ at the same time.
Understand the outlook numbers
BLS projects electrician employment to grow 9 percent from 2025 to 2035 and estimates about 72,700 openings per year on average over the decade. Many openings are expected to replace workers who transfer occupations or leave the labor force, not only to fill newly created positions.
An outlook projection is not a promise that a particular city, employer, or specialty is hiring. Use current local postings, apprenticeship recruitment notices, and state or regional labor-market information for a local decision.
Evaluate an offer beyond the hourly rate
For each opportunity, write down:
- base hourly wage and guaranteed or typical hours;
- overtime rules and expected schedule;
- health, retirement, leave, and training benefits;
- dues, tools, uniforms, travel, parking, and licensing costs;
- wage-review or apprenticeship-progression dates;
- job duration, work location, and travel expectations;
- employee versus independent-contractor classification.
Convert the offer to a realistic annual range using expected paid hours, then list benefits and costs separately. Avoid multiplying an overtime-heavy week by 52 or treating a temporary project rate as a permanent wage.
Use percentiles and averages carefully
BLS defines the median as the point at which half of workers earn more and half earn less. Percentiles show positions in the wage distribution, but they do not explain why one worker earns more than another.
For salary research, record the source, occupation code, geography, data year, and measure. If any of those differ, label the comparison rather than presenting it as a direct trend.
Build a local salary picture
Use this sequence:
- Start with the current BLS national electrician profile for context.
- Open the matching OEWS state and area estimates.
- Collect several current job postings with stated wage ranges.
- Obtain the written wage progression for any apprenticeship under consideration.
- Compare benefits, costs, schedule, and travel alongside wages.
- Recheck licensing requirements that may affect which jobs you can legally perform.
A careful comparison uses several compatible sources and keeps national statistics, local estimates, and individual offers in their proper roles.